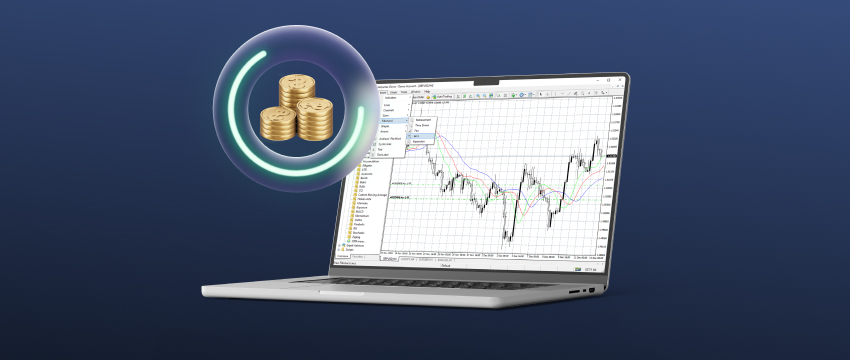
Most traders rely on technical analysis, often using مؤشرات MT4 such as المتوسطات المتحركة, RSI, MACD، و نطاقات بولينجر to analyze price charts and identify potential entry or exit points. In addition to technical strategies, fundamental and sentiment-based trading are two other popular approaches.
Fundamental traders focus on economic data, تقارير الأرباح، و macroeconomic indicators to assess intrinsic value, while sentiment traders analyze market mood through tools like news sentiment analysis, the Commitment of Traders (COT) report, or social media trends to predict price movements.
In this article, we’ll explore the difference between fundamental and sentiment traders and highlight some popular MT4 indicators.
What is fundamental trading?
Fundamental trading involves analysing news and economic data to understand how the economy of a country is performing. If the economy is strong, it is usually good for the country’s currency.
Traders who use this approach often look at an economic calendar and monitor economic indicators and data that would have the greatest effect on the currencies they are trading.
Central bank policy decisions like interest rate hikes or cuts are also important. Especially thosefrom big banks like the Fed, ECB or BoE, as well as geopolitical events.
Fundamental trading is better suited for long-term strategies because it looks at the bigger picture of an economy. However, this approach has some downsides.
Trends can take time to develop, the data can be complex to understand, and traders need to have a solid understanding of economics and politics. Sudden events such as central bank speeches or geopolitical news can quickly upend a trader’s analysis.
What is sentiment trading?
Sentiment trading is based on how traders feel about the market, whether they are optimistic or pessimistic.
Market sentiment refers to the mood of investors overall regarding a company, a sector, or the financial market as a whole. Market mood is affected by crowd psychology.
Generally, increasing prices reflect bullish market sentiment, while falling prices indicate bearish market sentiment.

Understanding market sentiment
Market sentiment, also known as investor sentiment, does not relate to fundamental changes in the market. Day traders and technical analysts use market sentiment to take advantage of short-term price changes caused by crowd behaviour.
Contrarian investors also use market sentiment by trading in the opposite direction of the crowd. For example, selling when most people are buying.
Market sentiment is usually described as either bearish or bullish. A bullish mood means prices are increasing, while a bearish mood means prices are falling.
Emotion often moves the market, so market sentiment can differ from fundamental values. Market sentiment shows how people feel about the market, while fundamentals show business performance.
Sentiment traders often use indicators like the Relative Strength Index (RSI) و Moving Average Convergence Divergence (MACD) to help identify whether a market is overbought or oversold.
For example, if 80% of retail traders are long on اليورو/الدولار الأمريكي, indicating a crowded trade, a sentiment trader might go short when the price starts to reverse, expecting a pullback as retail traders start closing their long positions. Markets overreact, and sentiment traders can capitalise on this.
Trading against the crowd at the right time can lead to big profits if the market reverses. Traders can also react quickly when the mood changes in the market.
However, sentiment can be hard to measure, and emotions can be irrational. Even if most traders are doing one thing, the market may go the other way.
Sentiment indicators
مؤشر الخوف والجشع
إن مؤشر الخوف والجشع measures sentiment between extreme fear and extreme greed on a single scale. Readings between 0-24 show extreme fear, 25-49 indicates fear, 50-74 is greed, and 75-100 is extreme greed.
Bullish Percentage Index (BPI)
إن Bullish Percentage Index shows how many stocks are in bullish trends. It moves between 0% and 100%. Readings above 70% indicate bullish market sentiment, while readings below 30% suggest bearish behaviour.
Market Volatility Index (VIX)
إن Market Volatility Index (VIX), often called the Fear Index, measures expected market volatility in the U.S. stock market over the following 30 days.
Move Index
إن MOVE Index measures volatility in the U.S. bond market. It helps investors track changes in volatility across treasuries.
Put/Call Ratio – Sentiment indicator
إن Put/Call Ratio is a popular sentiment indicator that compares the number of put options traded to call options. It helps traders to gauge market sentiment, whether it’s bullish or bearish.

Fundamental indicators
Most MT4 indicators used by المتداولون الأساسيون are custom-built (not included in MT4 by default), third-party plugins, and sometimes integrated via news/data APIs. These include:
News Calendar Indicators
إن MT4 News Calendar Indicator shows upcoming economic events and data releases, such as interest rate decisions, employment reports, and GDP figures directly on the trading chart. This information comes from sources like the Forex Factory calendar.
Traders can filter events by impact level (low, medium, high) and currency relevance, which makes it easy to prepare for market-moving news.
Real-time News Feed
إن News Feed in MT4 is a feature within the MetaTrader 4 trading platform that provides traders with access to real-time news and market information.
It is an integrated tool that keeps traders informed about important news events, economic data releases, and other information that impacts the forex market.
It offers a stream of news articles, economic calendars، و market analysis reports from trusted sources. Traders can access this information directly within the MT4 platform, usually through a built-in news tab or panel.
COT (Commitment of Traders)
In MT4, COT (Commitment of Traders) refers to a weekly report released by the U.S. Commodity Futures Trading Commission (CFTC).
It shows the net positions of different groups of traders, such as commercials, non-commercials, and large institutions in specific futures markets.
Economic Fundamental Indicators Overlay
إن Economic Indicator Overlay is a custom MT4 tool that displays important economic data like inflation rates, GDP growth، أو interest rates onto currency pairs, directly onto currency charts.
This indicator helps traders see how fundamental data is influencing market trends. It’s a helpful tool for spotting long-term trends and making decisions based on a country’s economic strength or weakness.
Fundamental Bond Yield Spread Indicator
إن Bond Yield Spread Indicator on MT4 shows the difference in yields between the bonds of two countries involved in a زوج العملات. Traders use it to understand how changes in interest rates might affect currency prices.
It can help predict currency movements before they happen.
Fundamental and sentiment trading
Both fundamental and sentiment trading offer alternative strategies, especially when used with the right tools.
Fundamental traders look at economic data, news releases, and macroeconomic trends to understand currency strength, while sentiment traders focus on crowd behaviour and market mood to predict price movements.
With custom MT4 indicators, such as News Calendars, Real-Time Feeds, the COT report, Economic Overlays, and sentiment tools, traders can use these strategies directly on their charts.
These indicators aren’t built into MT4 by default, but many are easy to find and install from third-party sources.
إخلاء المسؤولية: هذه المواد مخصصة للأغراض الإعلامية والتعليمية العامة فقط ولا ينبغي اعتبارها نصيحة استثمارية أو توصية استثمارية. T4Trade ليست مسؤولة عن أي بيانات مقدمة من أطراف ثالثة مشار إليها أو مرتبطة برابط في هذا الاتصال.


