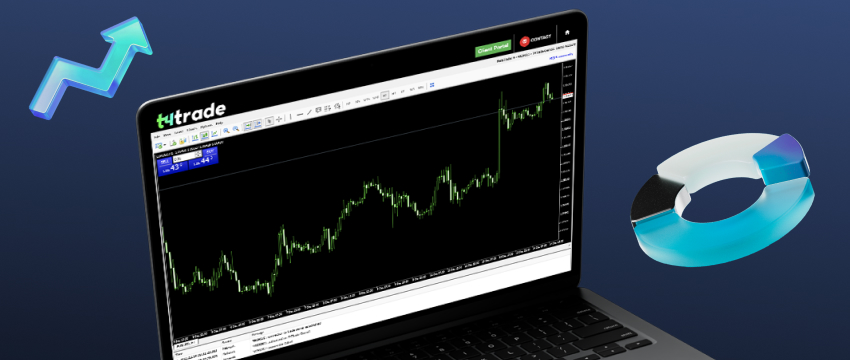
Every trader, beginner or experienced, faces the same challenge: how can I analyse the forex market like a pro? The answer lies in mastering the right tools. MetaTrader 4 (MT4) is one of the most trusted platforms, which offers powerful charting tools for precise technical analysis.
With the right approach, these MT4 charting tools can help you understand the market better, find opportunities, and make informed trading decisions. In this article, we’ll explain how to use MT4’s charting features to analyze the market like a pro.
Learn to read charts with MT4’s charting tools
While the charts may initially appear complex, mastering how to read them is crucial for anyone engaged in L'analyse technique. We’ll have a look at the basic concepts that apply to all types of trade charts.
- The price and time axis
- Pips and the exchange rate pricing
- Chart types (Line, Bars and Candlesticks)
- Time frames
The price and time axis
All trading charts have the same structure, using two axes. The horizontal X axis shows time and the vertical Y axis shows the exchange rate of the chosen instrument.
Charts are easy to use and include a zoom feature which allows traders to focus on specific time periods to understand past price movements. They are read from left to right, showing how the price has changed over time.
Pips and the exchange rate
A pip (or “percentage in point”) is the smallest possible change in the price of a currency pair. For USD-related currency pairs, one pip equals 0.0001. As pips are so small, they help limit huge losses during fast market movements.
Most currency pairs are quoted to four decimal prices, except for Japanese yen pairs, which use two decimal prices. However, because of algorithmic trading, many platforms offer precision pricing. This adds a 5th decimal place (or a 3rd for yen pairs) in the exchange rate.

MT4 charting tools: Chart types and how to read charts
Le MetaTrader Platform offers three different types of charts to observe live exchange rate changes: line charts, bar charts, et graphiques en chandeliers.
MT4 also includes various charting tools like indicateurs techniques, drawing tools, and multiple timeframes to enhance your market analysis.
MT4 charting tools: Bar charts show OHLC data
Bar charts show the open, high, low and close (OHLC) prices for each time period, such as one hour or one day.
The left dash of a bar shows the opening price and the right dash shows the closing price. The top of the bar marks the highest price traded on the market and the bottom marks the lowest price traded during that period.
The green bars, for example, are known as buyer bars, where the closing price is higher than the opening price. In contrast, the red bars are called seller bars, indicating that the closing price is lower than the opening price.
These bars form the basis of candlestick charts, the most popular chart type in forex trading.
Line Charts
A line chart graphically represents the price of an asset over time by connecting a series of data points with a line. It is the simplest type of chart and usually only plots the asset’s closing prices.
This reduces the noise from less important times in the trading day, such as the open, high, and low prices.
Line charts work for any time frame but are most often used to show daily price changes. Line charts are popular with investors and traders because closing prices give a clear view of a security’s activity.
Simple Line Charts
Simple line charts are ideal for tracking the price trend of a single asset to identify general trends and patterns.
MT4 charting tools: Multiple Line Charts
Multiple line charts plot several lines on one chart, each representing different data.
They are useful for comparing the performance of several securities, indexes, or other markets to identify relative strengths or weaknesses.
Compound (Stacked) Line Charts
Compound line charts, also known as stacked line charts, show the cumulative effect of multiple data sets.
They are useful for understanding how different asset classes contribute to the overall performance of a portfolio over time.
Candlestick Charts
Candlestick charts originated in Japan and are useful for recognising market sentiment and the balance of power between bulls and bears. Each candlestick represents a specific period and includes 3 components: real body, shadows, and colour.
Real Body
The real body or body is the rectangular part of a candlestick that shows the range between the opening and closing prices. A long body signals strong buying or selling, while a short body shows indecision in the market.
Shadows (Wicks)
Shadows or wicks are the lines above and below the body. They show the highest and lowest prices reached during the period and give insights into market volatility.
Candle Colour
The colour of the candle provides a quick view of price movement. A bullish candle is usually green or white and means the closing price is higher than the opening price, showing upward momentum.
A bearish candlestick, usually red or black, means the closing price is lower than the opening price, showing downward pressure.

Customise chart layout
For most traders, charts are the most important source of market information. That’s why good customisation is important. In MT4 you can change time frames (from 1-minute to monthly), apply custom colour schemes, and save templates for different strategies.
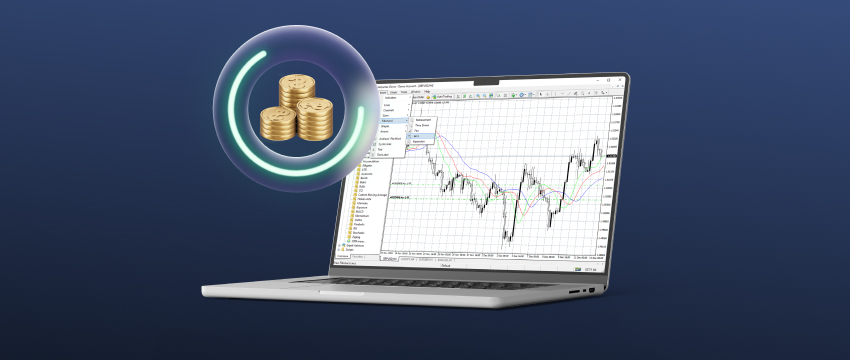
Use technical indicators wisely
MT4 offers many built-in indicators to help analyse market trends, momentum, and volatility. Some popular ones include:
Moyennes mobiles: These are used to identify price trends. Traders often use more than one type, such as Simple, Exponential, et Weighted Moving Averages to confirm signals.
MACD (Moving Average Convergence Divergence): A momentum indicator that helps identify trend changes and the strength of price movement.
RSI (Relative Strength Index) is a momentum indicator used to identify overbought or oversold conditions.
Bandes de Bollinger: A volatility indicator made up of three lines that show how far the price moves from its average.
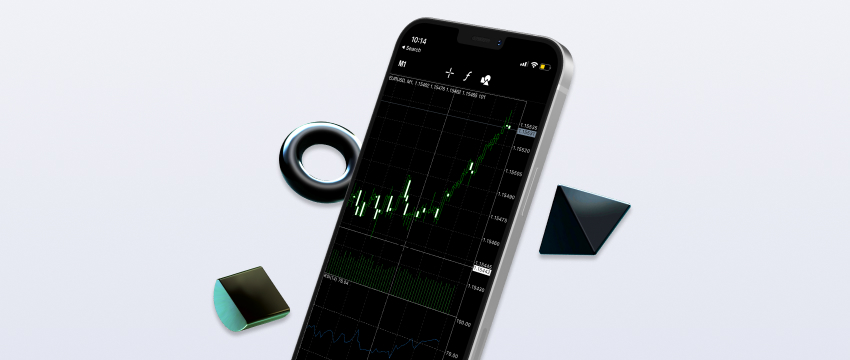
Monitor multiple time frames
The time frame you choose depends on your trading style and strategy. MetaTrader 4 offers many time frames:
Monthly, weekly and daily charts are best for traders who hold positions for long periods of time or swing traders.
4-hour, 1-hour and 30-minute forex charts suit traders who prefer intraday trading and hold positions for a few hours or days.
15-minute, 5-minute and 1-minute charts are best for traders who hold positions for very short periods of time.
In OHLC bar charts or candlestick charts, a new bar or candle forms at the end of each time unit. For example, on a 5-minute chart, a new candle forms every five minutes.
Metatrader 4 charting tools: Draw a trend line
The trend line is a useful tool for spotting the direction of a trend and potential breakout points, especially for medium- and long-term investors.
To draw a trend line, connect two points and watch for a third touch to confirm it. The strongest trendline comes from points that are easy to spot.
MT4 charting tools analysis
MT4 is more than just a trading platform. It’s a powerful tool to help you understand the market.
By learning how to use its charts, indicators, drawing tools, and time frames, you can analyse the market confidently, like a pro.
Whether you trade short-term or for the long term, MT4’s charting tools can help you make better decisions.
Avertissement : Ce document est fourni à titre informatif et éducatif uniquement et ne doit pas être considéré comme un conseil ou une recommandation en matière d'investissement. T4Trade n'est pas responsable des données fournies par des tiers référencés ou liés par hyperlien dans cette communication.