Do you want to trade forex but don’t know how to read charts and identify trends? Although forex trading charts and patterns aren’t always right, they can help you decide when it might be the best time to buy and sell currency pairs. In this article, we explain how you can read the three main types of forex charts like a pro.
What is forex trading?
So, what does forex trading involve? It involves buying and selling currencies. In a forex pair, there is the base currency and the quote currency, e.g. USD/EUR. When you trade forex, you’re looking at how much of the quote currency (on the right of the pair) you need to buy one unit of the base currency (on the left).
Therefore, when you trade forex, you’re buying one currency and selling another at the same time. The value of a currency pair depends on the relative value of the base and quote currencies, which determines whether a trade results in a profit or loss.
What are forex trading charts?
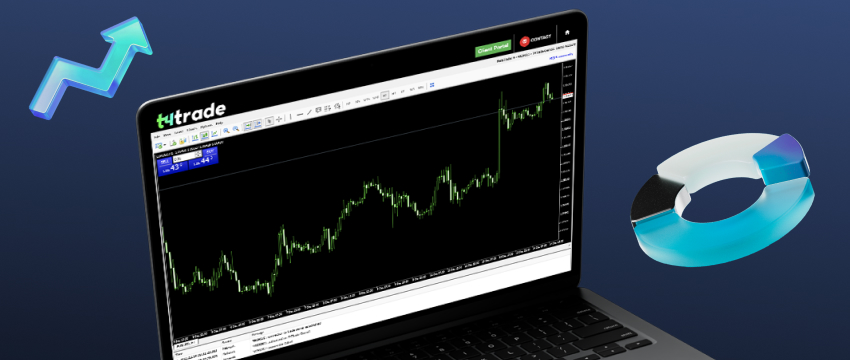
On a forex trading chart, you can see the price movement and trading volume of a currency pair over time. It shows how much a currency pair costs and how much trading activity there has been.
Why charts are used in forex trading
Charts are used in forex trading to show the movement of a currency pair over time, allowing traders to track historical price data and trading volume. From this, they can identify indicators and technical patterns. These patterns are used to identify when it is the best time to buy or sell a currency pair.
It’s important to note that there are no guarantees in trading. Analysing price data and patterns on a forex chart doesn’t mean it will result in profits. However, charts allow you to carry out technical analysis, which can provide information that’s useful when making buying and selling decisions.

The basic parts of a forex trading chart
There are different types of forex charts. However, the three most common charts include:
Line charts
Line charts are the easiest way to track forex price data. A line is drawn from the previous day’s closing price to the closing price of the current day. Over several days, the chart will show the increase and decrease of the currency pair’s price.
Bar charts
In forex trading, bar charts show a currency pair’s opening, closing, high and low prices for a given period. This information is shown by a bar, which is made up of a vertical line with two horizontal lines extending from it.
The bottom of the bar represents the currency pair’s daily low price, while the top marks the daily high price. A horizontal line on the left side of the vertical bar shows the opening price, and a horizontal line on the right side shows the closing price.
Each bar shows a price range. The longer the vertical bar, the wider the range between the low and high price. This is useful to know when assessing how much trading activity there has been, and how volatile the price is.
Candlestick charts
Candlestick charts are one of the most commonly used charts in forex trading. They’re a type of bar chart; the candlesticks show the opening and closing prices, as well as the day’s price range.
Candlestick charts have a body (the middle bar), an upper shadow (a thin vertical line extending above the body like a wick), and a lower shadow (a slim vertical line extending below the body).
The size of the body represents the range between the daily opening and closing price. A black or colour body means the price closed lower than it opened, while a white or hollow body shows the price closed higher than it opened.

The upper shadow shows the daily high, while the lower shadow shows the daily low. A candlestick therefore shows the opening and closing prices, the daily highs and lows, whether the market closed higher or lower, and the overall price range.
How to read a forex trading chart in 3 steps
That covers the basics. You should now understand what a forex trading chart is, why it’s used, and the three main types of charts you’ll typically see when you trade online. The final thing is learning how to read these charts:
1. Identify your chart
The chart type you use depends on both the trading platform’s capabilities and your preferences.
2. Identify patterns
Line charts don’t provide enough data to identify patterns. If you want to look for patterns and conduct technical analysis, candlestick charts are the preferred tool.
From candlestick charts, traders can recognise ten patterns by drawing lines between price points. These lines form distinct shapes that signal potential bullish or bearish trends.
3. Use patterns to make decisions
Spotting patterns on a forex chart is helpful, but it’s just one part of the story. For instance, an ascending triangle usually signals that the price could turn bullish. But patterns aren’t perfect – just because a chart suggests a bullish move doesn’t mean the price will follow. Technical analysis cannot show with 100% certainty what a currency pair is going to do, but it may give clues about what might happen.
Using charts and patterns in forex trading
Forex trading is a game of incomplete information. Some factors are known, while others like economic disasters are unpredictable. You can’t predict future events like this, which means you can never know for certain what’s going to happen.
That’s why you have to work with the information available, and that’s where forex charts and technical analysis come in. By studying price patterns, such as an ascending triangle, you can take it as a sign that a bullish trend may have formed.
Understanding the Limits of Technical Analysis
However, it is important to know that past performance is not a guarantee of future results.
Technical analysis is just one method of analysing a financial instrument. It’s a valuable tool, but it’s not the only one. You can also use fundamental analysis, which analyses economic and financial factors, or quantitative analysis, which relies on mathematical models.
Learning to read forex trading charts is one approach, and for some traders, it’s the main focus. However, there is value in exploring other ways to analyse forex. Doing this will make you a more effective and adaptable trader.
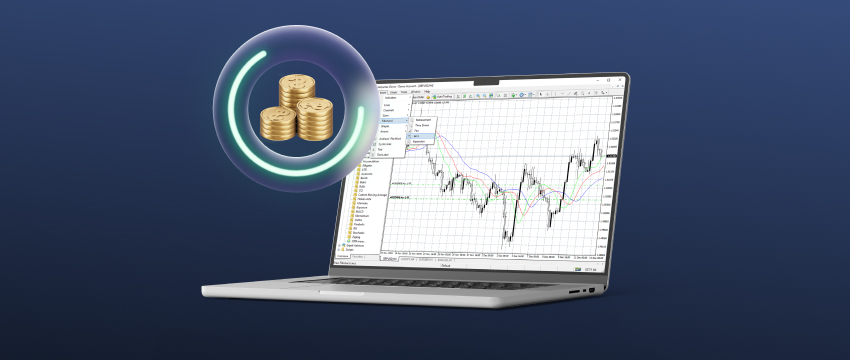
The most effective way to learn how to read forex charts, and practise other types of analysis, is by using a demo account. A demo account allows you to look at charts and practice identifying patterns without risking real money. Once you feel comfortable using this type of analysis, you can switch to a live account and start trading with real funds.
Disclaimer: This material is for general informational and educational purposes only and should not be considered investment advice or an investment recommendation. T4Trade is not responsible for any data provided by third parties referenced or hyperlinked in this communication.