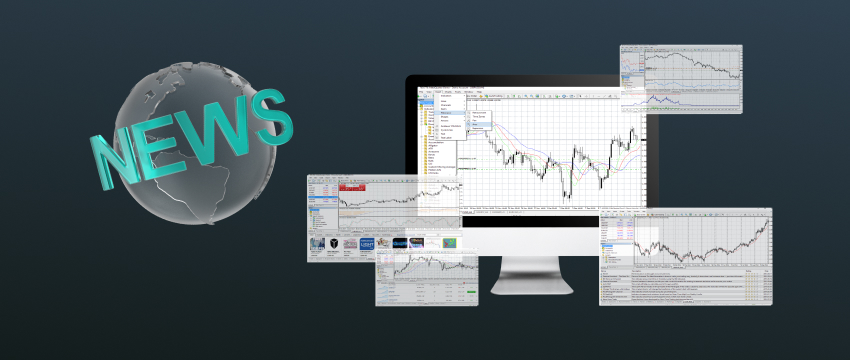
Os mercados financeiros movem-se muito rapidamente à medida que relatórios económicos, anúncios dos bancos centrais e eventos geopolíticos súbitos provocam mudanças constantes. Este é um desafio para a maioria dos traders, porque não sabem em que se concentrar. Devem concentrar-se em cada manchete ou no próprio mercado de negociação? Este artigo explora porque é que muitos traders confiam mais nos gráficos do que nas notícias.
Os gráficos frequentemente refletem o comportamento do mercado. As notícias podem, por vezes, induzir em erro ou já estar refletidas no preço. A análise técnica oferece aos traders sinais mais claros e fiáveis.
Clareza dos gráficos vs. ruído das notícias
O ruído das notícias financeiras
Publicações económicas, anúncios políticos e estratégias dos bancos centrais dominam as manchetes diariamente, criando um fluxo interminável de notícias financeiras no mundo atual impulsionado pelos meios de comunicação.
No entanto, para além do limite, existe clareza nas notícias fornecidas? Essa é uma história diferente. Em suma, o ponto não é focar no que o mercado fará por causa das notícias, mas sim em como ele reage a elas.
Mudar o seu foco de adivinhar os movimentos do mercado para observar as reações reais pode parecer algo pequeno, mas é importante.
Muitos novos traders tomam decisões naturalmente com base no que leem ou ouvem nos meios de comunicação. No entanto, os traders profissionais geralmente escolhem um caminho diferente, recorrendo aos gráficos, pois estes fornecem dados não filtrados, como preço, volume e padrões.
Ao apresentar os dados de forma visual e em tempo real, os gráficos ajudam os traders a interpretar o comportamento do mercado em vez de dependerem de suposições.
Por que os gráficos contam a história real
As notícias são ruidosas por natureza. As grandes instituições frequentemente agem antes que as notícias cheguem ao público. Como resultado, o mercado ajusta-se antecipadamente, deixando pouco espaço para surpresas.
Notícias aparentemente “boas” podem levar a uma queda nos preços, enquanto notícias “más” podem resultar numa alta. Se você é um trader que depende apenas do ciclo de notícias, essa discrepância pode frequentemente causar confusão e até frustração.
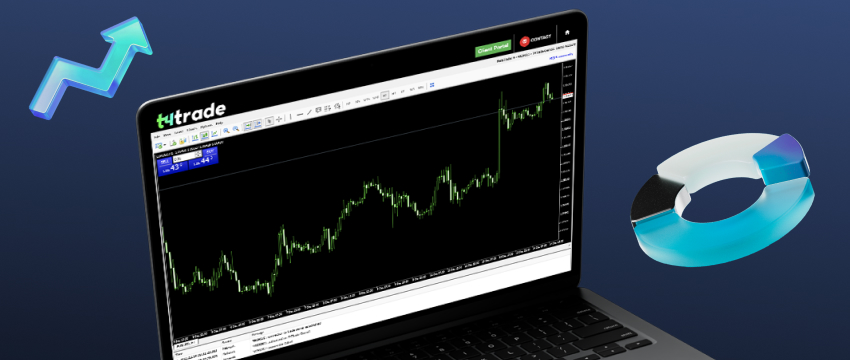
Por outro lado, os gráficos são um verdadeiro reflexo de como os mercados realmente se comportam em tempo real. Todas as informações conhecidas, como rumores, expectativas ou resultados reais, estão resumidas na ação do preço. Isso torna o gráfico uma ferramenta fiável para a tomada de decisões.
Gráficos e Psicologia do Mercado
Outra razão pela qual muitos traders confiam mais nos gráficos do que nas notícias é que os gráficos refletem a autêntica psicologia do mercado em tempo real. Cada movimento num gráfico de preços mostra o que os traders estão a sentir, seja medo, hesitação ou ganância.
Em vez de tentarem interpretar as notícias, os traders podem estudar como os participantes do mercado realmente se comportam. Essa ideia — de que todas as informações relevantes, sejam elas fundamentais ou especulativas — acabam por se refletir no preço, é a base das estratégias de ação do preço.
Por exemplo, os padrões de velas são uma forma muito antiga de decifrar o sentimento.
Uma vela doji mostra indecisão, enquanto um martelo indica rejeição altista de preços mais baixos. Um padrão de ombro-cabeça-ombro pode sinalizar uma reversão de tendência.
Os traders consideram esses padrões úteis porque expõem o comportamento humano, permitindo uma ação clara e imediata.
Da mesma forma, ferramentas modernas como os gráficos Heikin-Ashi ou as médias móveis foram concebidas para suavizar o ruído de curto prazo e ajudar os traders a identificar tendências com mais facilidade. Assim, os gráficos transformam as emoções do mercado em indicações claras que os traders podem usar nas suas decisões.
Quando os mercados se movimentam antes das notícias
Há momentos em que os mercados reagem mesmo antes de as notícias serem divulgadas. De acordo com o ditado “compra no rumor, vende no fato”, os preços geralmente movem-se antes de um evento porque os traders já o estavam a antecipar.
Vamos ver um exemplo.
Quando muitos traders esperam que as taxas de juro aumentem, uma moeda pode fortalecer-se antes do anúncio oficial.
Depois disso, quando a notícia confirma o aumento, o preço pode, em vez disso, cair. Se você reagir apenas à manchete sem olhar primeiro para o gráfico, há chances de entrar na negociação no momento errado.
Também existem armadilhas psicológicas comuns, como quando os traders veem nas notícias apenas o que querem ver — algo conhecido como viés de confirmação. Há ainda outros traders que mantêm negociações perdedoras na esperança de recuperar na próxima.
Isto está ligado à aversão à perda. Outras vezes, os traders concentram-se demasiado numa manchete e ignoram o panorama geral. Isso também é conhecido como viés de ancoragem.
Como resultado, os gráficos evitam que os traders cometam esses erros. Na verdade, os gráficos geralmente mostram o que já aconteceu — não tentam convencê-lo de nada — o que os torna objetivos na maioria das vezes.
Por que os padrões de gráficos são os mais importantes
Os traders confiam nos gráficos porque estes mostram padrões repetitivos de forma consistente. As manchetes podem mudar constantemente, mas os padrões gráficos continuam a aparecer de maneiras familiares.
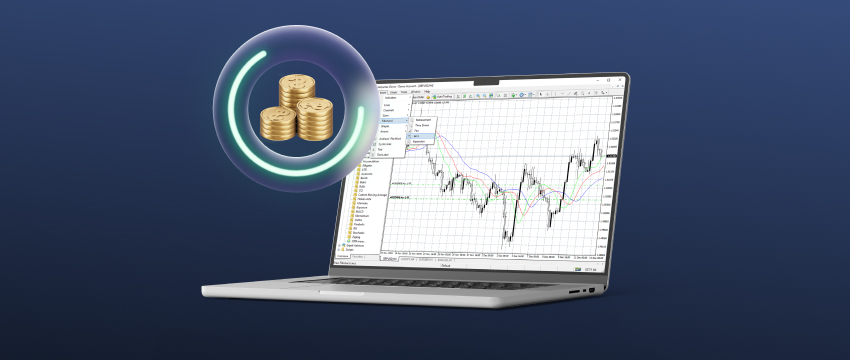
Por exemplo, um duplo fundo pode sinalizar uma reversão, uma bandeira pode sugerir continuação da tendência e um RSI sobrecomprado pode alertar para uma correção. Como é possível estudar e testar esses padrões, os traders podem tirar o máximo proveito deles.
Por exemplo, um duplo fundo pode sinalizar uma reversão, uma bandeira pode sugerir continuação da tendência e um RSI sobrecomprado pode alertar para uma correção. Como é possível estudar e testar esses padrões, os traders podem tirar o máximo proveito deles.
As notícias são rápidas, imprevisíveis e até stressantes. Normalmente, apenas os traders profissionais conseguem lidar com grandes mudanças causadas pela divulgação de notícias. Para a maioria dos traders de varejo, é muito difícil lidar com o risco de slippage ou com o risco de lacunas inesperadas e grandes movimentos nos preços.
Análise Técnica e Controle Emocional
Negociar não tem apenas a ver com gerir números. Também está relacionado com controlar as suas emoções. Ter a mentalidade correta é igualmente importante para ter uma boa estratégia de negociação. As notícias naturalmente despertam emoções.
Pense nas notícias de última hora, que muitas vezes são dramáticas. O seu sentido de urgência pode levar a decisões de negociação impulsivas. Mesmo traders experientes podem falhar em gerir as suas emoções, o que frequentemente leva a más entradas, excesso de negociações ou saídas inadequadas.
Por outro lado, os gráficos normalmente incentivam a autodisciplina. Os traders que utilizam configurações técnicas como o cruzamento de médias móveis, uma reversão de velas ou uma quebra acima da resistência, conhecem os seus pontos de entrada e saída antes de iniciarem a negociação.
Dessa forma, evitam correr atrás do mercado ou deixar as emoções interferirem quando surgem notícias inesperadas. Embora não exista uma estratégia perfeita, provavelmente obterá uma estrutura clara ao utilizar configurações técnicas, tornando mais fácil manter a objetividade, seguir o seu plano e controlar as suas emoções.

Considerações finais
As notícias e os fundamentos certamente desempenham um papel fundamental na negociação forex, pois ajudam os traders a compreender as tendências de longo prazo. Os dados de inflação ou as alterações na política dos bancos centrais, por exemplo, podem revelar a direção futura do mercado.
No entanto, para agir com base nessas informações, a maioria dos traders recorre aos gráficos para orientar o seu timing. Um gráfico de preços mostra todas as expectativas, reações ou rumores incorporados no mercado — ou seja, o que os traders, como grupo, estão realmente a fazer.
Em contraste com as manchetes, que às vezes podem ser enganosas ou confusas, os gráficos mostram como os traders estão realmente a gerir os seus fundos.
Eles eliminam o ruído e mostram padrões que os traders podem ler, testar e usar novamente. As notícias não devem ser ignoradas, mas, para uma tomada de decisão rápida, os gráficos são geralmente mais fiáveis.
Isenção de responsabilidade: Este material destina-se apenas a fins informativos e educativos e não deve ser considerado como conselho ou recomendação de investimento. A T4Trade não se responsabiliza por quaisquer dados fornecidos por terceiros referenciados ou hiperligados nesta comunicação.