
As major central banks inch closer to the end of their tightening campaigns, bullish sentiment amongst international investors reaches new heights, due to the anticipation of looser monetary policy conditions, which increases the possibilities for free-up of capital flows for stock portfolio allocations. Hence, a question arises. What market will be on the receiving end of this renewed wave of capital allocation? In this equities report we aim to present and analyze the latest fundamental influxes that steer the performance of two heavyweight Asian stock market indices, namely Japan’s Nikkei 225 and China’s Shanghai Composite, and conclude with a technical analysis of the former.
Japanese equities cross into fresh 34-year high territory.
In today’s early Asian session, Japanese stocks formed leg higher and technically broke above the $33800 peak formed back in June of 2023 and ventured into territory once seen before in January of 1990. Investors continue to pile in Japanese blue-chip stocks, as the latest fundamental data from the land of the rising sun pointed to softer inflationary pressures in Tokyo and weakened household spending trends.
Leading the gains were the index heavyweights Sony, Nintendo, Yamaha and Olympus Corporation to name a few, yet almost all sectors participated in the advance, which lifted Nikkei 225 by over 2%, showcasing a renewed bout of overall optimism. The updated economic outlook in a sense favoured flows towards equities with the data practically pushing back on speculatory projections that the Bank of Japan will soon pivot from ultra loose monetary policy and start hiking rates.
Contributing to the funnelling of funds into Japanese stocks was also the relatively weak performance of the Japanese Yen since the start of the year, but also the renewed interest in tech heavy stocks in the United States as investors’ risk on approach remains intact ahead of a crucial US CPI print tomorrow Thursday. Upcoming updates from Japan that could interrupt or on the contrary boost the performance of both Nikkei and TOPIX are the preliminary releases of the Leading Index and Coincident indicator, two forward looking measurements that gauge how the current economic conditions affect the overall environment of the Japanese economy.
Chinese stocks hover near 3 and half year lows
In stark contrast to the performance of Japanese equity markets, Chinese stock markets reflect international investors’ reluctancy and hesitancy at allocating capital in the Red Giant, which primarily stems from the lack of projected policy measures from Beijing.
Both the Shanghai Composite and Hang Seng indices echo vibes of pessimism given that the former has veered into territory last visited back in over 3 and half years and the latter attempts to form base near 14-month lows, as negative momentum accumulated traction, whereas buying interest is thinning out at same pace with investors’ patience. Forecasters from major financial institutions have been increasingly expecting for a much steadfast approach from Chinese authorities to shore up pent-up domestic demand, stimulate growth and prop up the ‘faltering’ recovery process of the Red Giant, before channeling flows, which has not yet materialized and thus causes the aforementioned lack of vibrancy in Chinese stocks. Furthermore, the absence of policy easing from PBOC by cutting rates serves as another headache for investors who have places bets on a faster economic turnaround from China.
Up next for Chinese markets will be the upcoming data releases on the inflationary front, which will update whether the economy can steer its way out of the recent plunge in deflationary territory, alongside the highly anticipated and, more grave in its impact, trade balance for the month of December, in Friday’s early Asian session.
Equities 技术分析
Nikkei225 Daily Chart
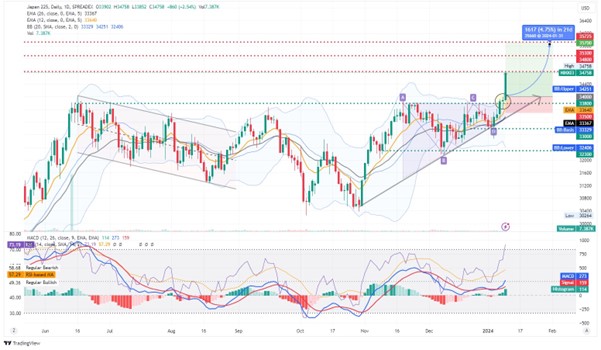
Looking at Nikkei 225 Daily chart we observe the technical breakout above the former, thrice challenged 33,800 resistance boundary, taking place in today’s early Asian session and aggravated bullish momentum lifting the index to levels once seen before in January of 1990, recording fresh 34 year highs. We hold a bullish outlook bias for the index given, the formation, completion and clear breakout from the month-long ascending triangle pattern formation with an unmistakably strong conviction.
Furthermore, adding to our bullish case are several technical indications that point to the extension of the move to higher ground, including but not limited to, the sequential formation of higher lows evident from the ascending trendline (and now higher high), the clear crossover of the MACD line above the signal line according to the MACD indicator below our daily chart and the spike of the RSI indicator above the 70 overbought bound.
Should the bulls maintain their reign, we may see the break above the 34,800 (R1) closest resistance barrier and move closer to the 35,300 (R2) resistance level. Should on the other hand the bears take over, we would expect Nikkei 225 to return to the 33,800 (S1) support level and should bearish momentum accelerate, we may see a move closer the 33,000 (S2) support base.
Disclaimer: This material is for general informational & educational purposes only and should not be considered investment advice or an investment recommendation. T4Trade is not responsible for any data provided by third parties referenced or hyperlinked, in this communication.