
Crude oil uncharacteristically floats calmly around the $72 per barrel level at the time of this report despite the recent flare-up of tensions in the Red Sea, where Houthi rebels attack maritime vessels and US allied forces strike back in a game of tic-for-tac. Keeping a lid on top of crude prices nonetheless, is the systematic underperformance of the globe’s largest manufacturing powerhouses, whose shortcomings lead to stifled demand fundamentals that act as a balancing mechanism for the price of the commodity. This report aims to analyze the fundamental drivers influencing WTI’s price action seeks to assess its future outlook and concludes with a technical analysis.

Crude whipsaws after Red Sea escalations
Shenanigans in the Red Sea have no end, as US and UK allied forces continue to pummel on Houthi infrastructure in Yemen, in attempts to contain the rebel group’s catastrophic intentions. Over the past month or so, Houthi rebels have been indiscriminately firing rockets on maritime vessels that traversed through the Bab El-Mandeb strait in a show of protest as to what has been going on in the Gaza strip, vowing to ‘destroy any ship’ that transports aid and supplies to Israel. To counter the acts of mindless aggression of the Yemeni rebels, the United States created in concordance with other allies, first and foremost the British, a new operational naval taskforce, dubbed Operation Prosperity Guardian, which is now stationed near the Gulf of Aden, south of the coast of Yemen and serves as a ‘policing’ unit, which aims to provide safe passage of maritime vessels via the Red Sea.
The allied forces have struck 16 critical infrastructure locations in Yemen over the past few days, such as telecommunication centers, munitions depots, launching systems, production facilities, and air defense radar systems, in attempts to degrade the Houthi’s ability to recklessly attack maritime and commercial vessels and also issued a joint statement noting “the Houthis will bear the responsibility for the consequences should they continue to threaten lives, the global economy, or the free flow of commerce in the region’s critical waterways”. Taking turns, the Houthi militia threatened with “strong and effective response” against the United States yesterday, vowing that the attacks won’t go unaddressed, pointing to a substantial increase of probabilities for further escalation of tensions in the Middle East.
According to the ship tracking service Vortexa, since the second half of December, at least 32 tankers have diverted or transited via the Cape of Good Hope, instead of using the Suez Canal (which before the incident hosted 15% of global trade flows), which lead to the prolongment of delivery times alongside the increase in costs of shipping vessels, creating losses and headaches for ship handlers. Crude nevertheless floats around the $72 per barrel level at the time of writing, despite the stir-up of tensions and analysts point out that the lack of price spikes was primarily countered by subdued fundamental demand forces, keeping the price still for the time being.
Stifled demand puts a cap on crude’s oil price
As tensions in the Middle East run the possibility of getting out of hand, leading to severe supply bottlenecks and the reignition of a vicious cycle of price hikes, the demand side of the commodity currently undergoes a prolonged period of stagnation, keeping prices subdued between a tight trading range. A slowdown in economic activity in Europe over the last quarter negatively impacted the demand for the precious commodity, as the bloc’s manufacturing powerhouse, Germany, feels the heat from a high-interest rate environment and lack of investment in key infrastructure projects.
China on the other hand, the world’s largest manufacturing nation still struggles with its recovery progress with systematic underperformance on the industrial output front, domestic spending but also in its exporting capabilities. Finally, the US shares a similar fate, as its manufacturing capacity showcases mixed signals month after month, capping further the demand for the commodity. Furthermore, the latest US crude oil inventories data pointed to a larger-than-expected buildup in stocks which coincides with the overarching theme likewise the latest Baker Hughes oil rig count showed that the number of active oil rigs in the US has decreased by two another indication of pent-up demand. Nevertheless, WTI traders’ attention will now shift towards the upcoming OPEC monthly report coming on Wednesday and the official OPEC meeting for clues as to how the cartel will act in the months ahead with its production output plans.
Oil Technical Analysis
WTI Cash Daily
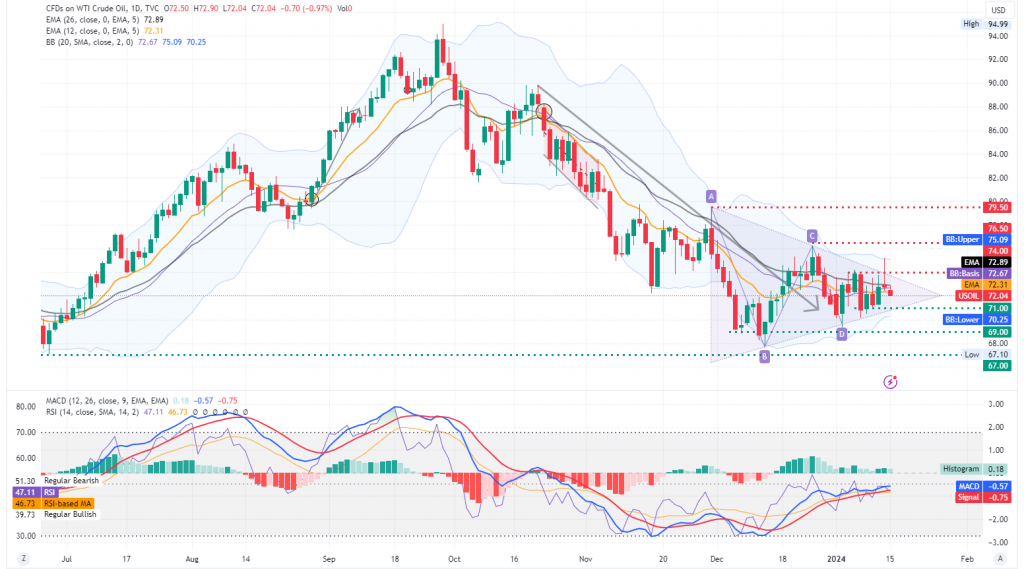
Looking at the WTI Daily chart we observe that crude prices are heading steadily for the apex of the symmetrical triangle created at the start of December, as persistent slack in demand cancels out revamped supply worries stemming from the escalation of tensions in the Red Sea. We hold a sideways bias for the commodity, expecting it to gyrate between the $71 (S1) and $74 (R1) bounds for the time being, until either the bulls or the bears take decisive action over the direction of the commodity. Validating partly our views for an impending sideways trading activity is the RSI reading below our daily chart, registering a value of 47 which indicates indecision alongside the flattening out of both the MACD and signal lines slightly below the zero line.
Various other technical indicators such as the Commodity Channel Index and Stochastic also do not provide valuable information for the time being, favoring a ‘wait and see’ approach for WTI. Shall the bulls dominate over the direction of the commodity, we may price action breaking decisively past the $74.00 (R1) resistance level and head towards the $76.50 (R2) resistance barrier, whereas should on the other hand, the bears take over, we may see the break below the $71.00 (S1) support level and the fall of the commodity near or below the $69.00 (S2) support base.
免责声明: This material is for general informational & educational purposes only and should not be considered as investment advice or an investment recommendation. T4Trade is not responsible for any data provided by third parties referenced or hyperlinked, in this communication.