The forex market is the largest and most active financial market in the world. With a daily trading volume of US$6 trillion, understanding its mechanics is vital to achieving trading success. One way traders navigate the complexities of this market is by using tools like technical indicators.
An extensive range of technical indicators exists that help traders analyse market data and predict future price trends. The MetaTrader 4 (MT4) trading platform for instance offers 30 built-in indicators, 2000 free custom indicators and 700 paid ones. These indicators give traders a way to become better informed on market behaviour and improve trading outcomes.
In our first two articles in our technical indicators series, we examined many of the most popular indicators used by global traders to make trading decisions. In this series 3 article, we’ll discuss further 5 technical indicators that help traders decide whether to enter or exit specific trades.

Bears Power technical indicator
The Bears Power technical indicator is a type of momentum oscillator that is used in technical analysis to measure the strength of the bears (sellers) in the market. It was developed by Alexander Elder, a well-known trader and author of several books on trading.
The Bears Power indicator is calculated by subtracting the 13-period exponential moving average (EMA) from the highest price of a certain period. The resulting value is then plotted as a histogram below the price chart. The indicator is used to identify potential selling opportunities in the market.
When the Bears Power indicator is above the zero line, it indicates that the Bears are in control of the market. This is an optimal time to find buy signals.
Traders often use the Bears Power indicator in conjunction with other technical indicators and price patterns to confirm their trading decisions. It’s important to note that like all technical indicators, the Bears Power is not foolproof. It is typically used in combination with other analysis tools (particularly Moving Average) to enter or exit trades.

Bollinger Bands technical indicator
Bollinger Bands is a popular technical analysis tool used to help traders and investors:
- measure volatility in financial markets
- identify price trends (overbought or oversold conditions).
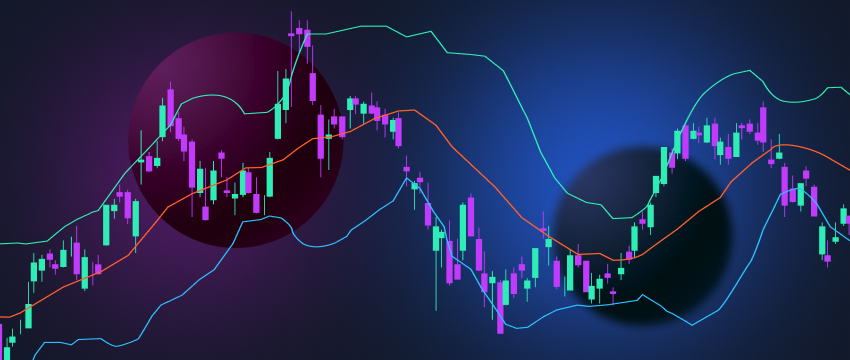
The Bollinger Bands consist of three lines that are plotted on top of a security’s price chart. The middle line is a simple moving average (SMA) of the security’s price over a specific period of time, typically 20 days. The upper and lower bands are two standard deviations above and below the moving average line.
The upper band serves as a resistance level, while the lower band serves as a support level. The two measure volatility or the degree of price variation over a particular period and adjust automatically to changing market conditions. When prices rise, the bands move apart. In contrast, when prices go quiet, the bands move closer to each other.
Traders often use Bollinger Bands in conjunction with other technical analysis tools to confirm potential trading opportunities. However, it’s important to remember that no technical analysis tool can guarantee profits, and traders should always consider their own risk tolerance and financial goals before making any trading decisions.
Bulls Power technical indicator
Bulls Power is a technical indicator used in financial analysis to measure the strength of buyers in the market. It is calculated by subtracting the exponential moving average (EMA) of the closing price from the high price of each period.
A positive value for Bulls Power indicates that buyers are in control of the market, while a negative value indicates that sellers are in control. The greater the positive value, the stronger the bullish momentum, and the greater the negative value, the stronger the bearish momentum.
Traders often use Bulls Power in combination with other technical indicators, e.g., Relative Strength Index (RSI) and Moving Average Convergence Divergence (MACD), to make trading decisions. However, it’s important to keep in mind that no indicator can predict future market movements with certainty. Traders should always use proper risk management techniques when trading.
Commodity Channel Index (CCI) technical indicator
The Commodity Channel Index (CCI) is a technical indicator used in financial markets to help traders identify price trends and strengths. Developed by Donald Lambert, the CCI also helps traders establish whether an instrument is reaching a condition of being overbought or oversold. Using CCI, traders can better decide whether to enter, exit or refrain from taking a trade.
The CCI measures the difference between an asset’s current price and its historical average price, relative to normal market volatility. The resulting CCI value oscillates above and below a zero line, with positive values indicating that the asset’s price is above its historical average and negative values indicating that it is below. Traders often look for divergences between the CCI and price movements, as well as overbought and oversold conditions, to help identify potential buy or sell signals.

DeMarker technical indicator
The DeMarker indicator is a technical analysis tool used to measure the demand for an asset by analysing its price action over a specified period of time. More specifically, it does this by comparing the most recent maximum and minimum prices to the previous period’s equivalent price. The DeMarker technical indicator was developed by Tom DeMark and is also commonly referred to as the DeM indicator. Like all technical indicators, the DeMarker indicator should be used in combination with other indicators and analysis techniques.
Trading with T4Trade
T4Trade is a popular forex broker used by traders worldwide. T4Trade has quickly gained recognition for its trading expertise, top-tier, multilingual customer support, and flexible trading conditions. T4Trade’s MetaTrader 4 platform provides traders with most of the trading tools required to make strategic trading decisions and maximise profits. T4Trade is also best known for:
- Fast execution of trades
- Access to more than 300 financial instruments across 6 asset classes (forex, metals, futures, shares, commodities, indices)
- Competitive spreads
- Security of funds
Optimising your trading skills with T4Trade
The T4Trade Academy offers a wide range of resources to help traders boost their skills and enhance their trading know-how. This includes a series of educational webinars, videos-on-demand, and podcasts. These learning tools are characterised by informative trading tips and market insights to increase trading expertise. Informative blogs and FAQ pages further hone the learning experience.
Disclaimer: This material is for general informational & educational purposes only and should not be considered investment advice or an investment recommendation. T4Trade is not responsible for any data provided by third parties referenced or hyperlinked, in this communication.


